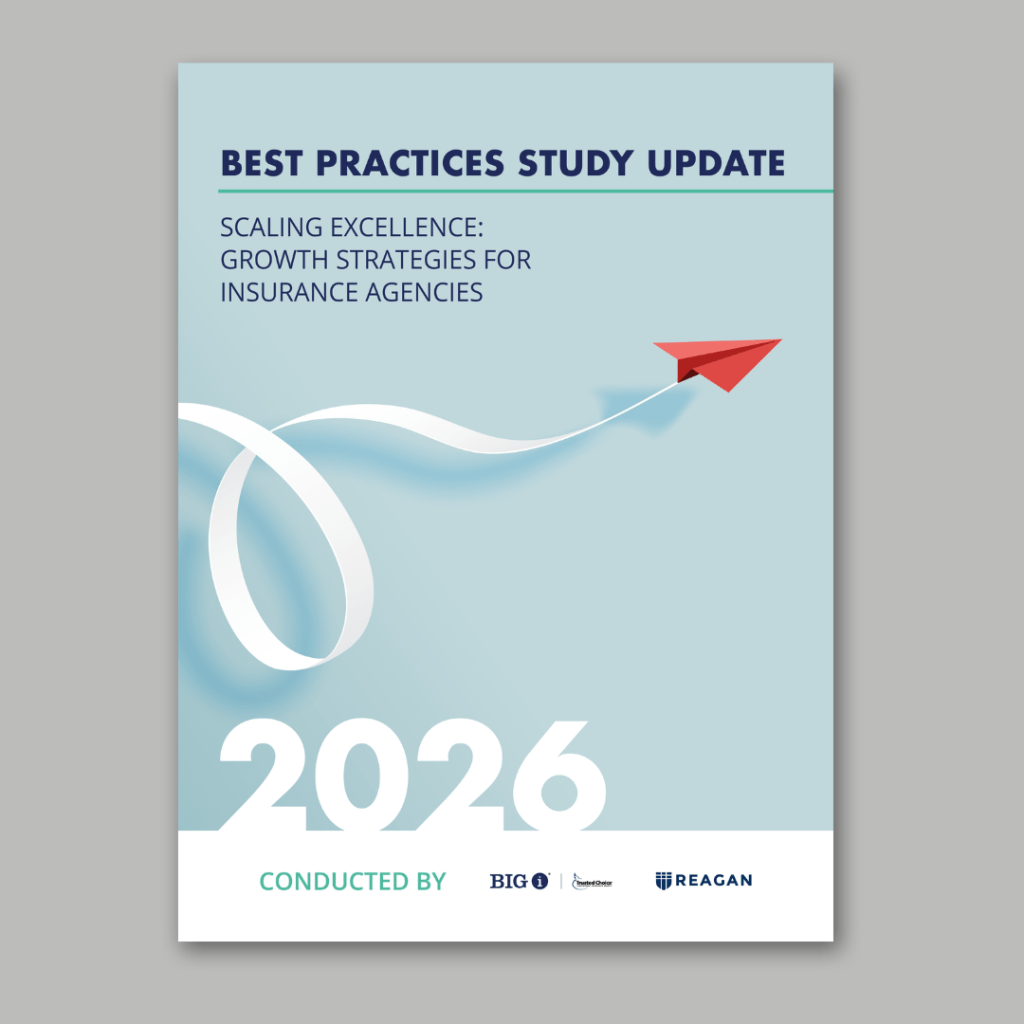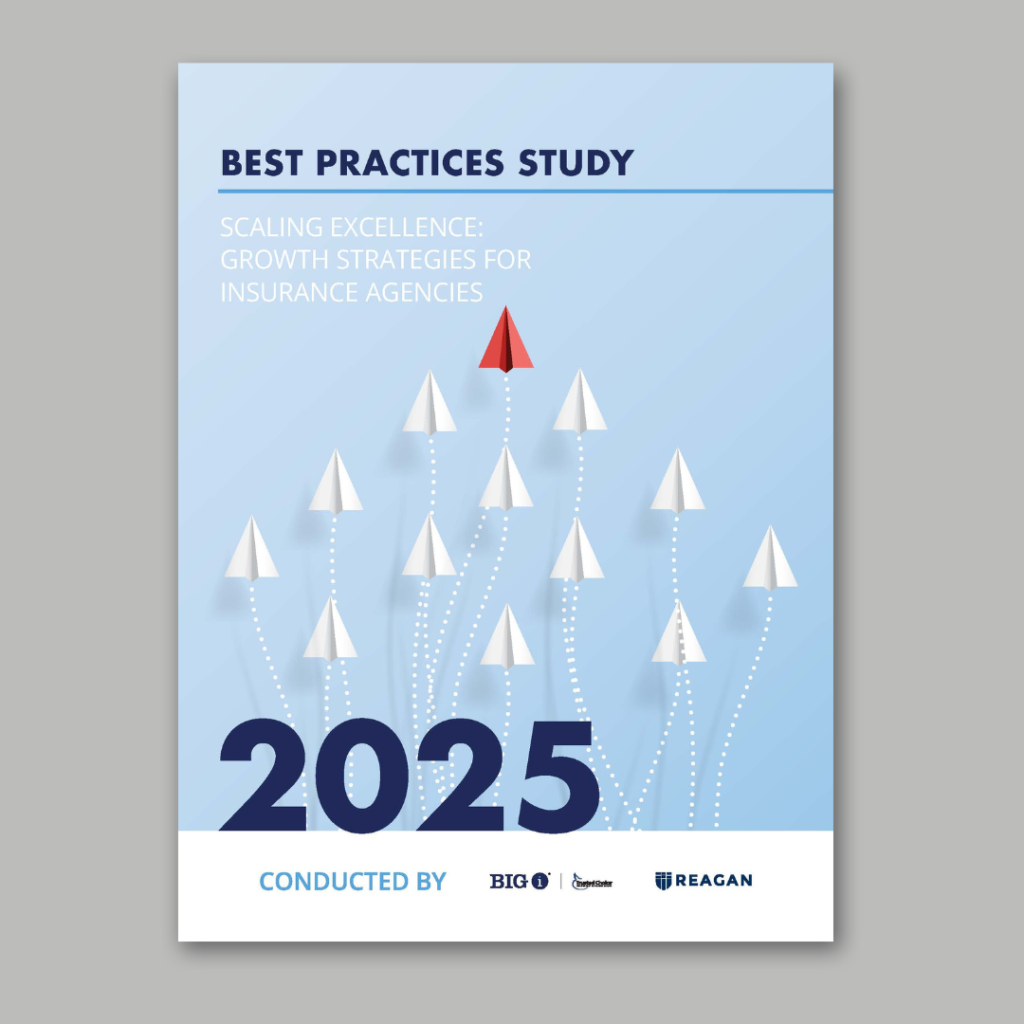
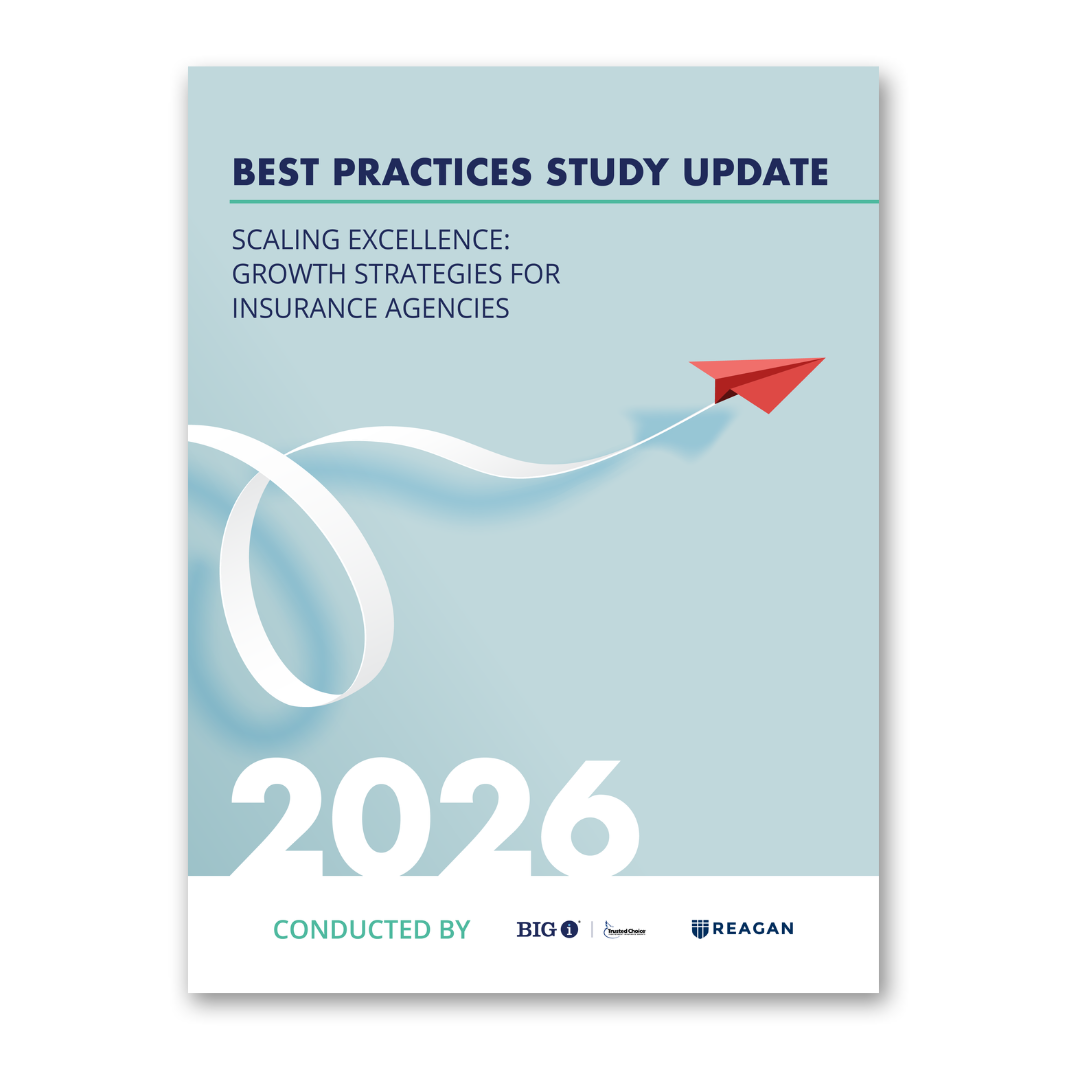
2026 Best Practices
Study.
Unlock insights with seven revenue categories, key benchmarks and over 3,000 data points.
The annual Best Practices Study originated in 1993 as an initiative by the Big “I” to help its members build and maintain their value. By studying the leading agencies and brokers in the country, the study provides businesses with meaningful performance benchmarks and business strategies that can be adopted or adapted to improve agency performance.
The data provided by the Best Practices study allows benchmarking information which provides an objective baseline to measure performance, identify inefficiencies, and drive strategic decision-making. By comparing internal processes, metrics, or strategies against industry standards or direct peers, your agency can systematically improve operations.
The 2025 report provides the following information and will be delivered electronically.
- New in 2026! Producer Hiring Velocity statistic. In an attempt to simplify producer hiring benchmark, a new statistic – producer hiring velocity – has been added to the report.
- Executive Summary
- Analysis of Agencies by Revenue Category: Detailed analysis with over 3,000 data points in the following revenue categories:
- Under $1.25M
- $1.25M – $2.5M
- $2.5M – $5.0M
- $5.0M – $10.0M
- $10.0M – $25.0M
- $25.0M – $100M
- Over $100M
- Cross-Category Comparison: An easy to read comparison across each revenue categories
- Glossary of Terms: A complete list of key terms and definitions for clarity
Inside the Best Practices Study.

Introduction

Revenue Categories

Cross-Comparison
Glossary