About this article: The author studied the differences between high growth agencies in his territory and those that were not growing or growing only marginally. He determined that a key differentiator for the high growth agencies is that they tracked and acted upon key metrics relating to the origins of their business, close ratios, revenue and policies per client, retention and average client tenure. Based on his research, the author then outlines the twelve key metrics agencies should track to maximize their marketing efforts and grow their business. He also lays out how agencies can generate those metrics.
Independent agents should be winning in the personal lines marketplace, even dominating. Is there any other industry where companies selling just one option have a majority of the market share over other companies in that industry selling multiple options of the same product? Think of cars, ice cream, or appliances. The company selling multiple brands consistently beats companies selling just one option. And yet, in the world of personal lines insurance where independent agencies have multiple insurance carriers to sell and choose from, independent agents have around 31% of the personal lines market share. (A.M. Best 2018 data) Its been this way for over 10 years, almost no movement. In the business lines marketplace, independent agents hold 76% market share and that hasn't changed much for 10 years either. (A.M. Best 2018 data)
High Growth Agencies Track Metrics
While most agencies change little in size of their books of business, there are high growth agencies consistently increasing their total personal lines books by 13 to 20% and their business lines books by 19 to 30%. (Safeco Personal Insurance 2019 Annual Growth Survey and Liberty Mutual Business Insurance 2019 Annual Growth Survey) Comparing the commonalities of these agencies, it's clear that they stand out in their sales methods, emotional connections with their communities, and support. One thing really was truly unique these agencies tracked their marketing efforts and knew what was effective and what was not.
Marketing an independent agency is different from marketing an insurance company. Large insurance companies need to drive greater name recognition. But like all small businesses, insurance agencies need to be more efficient, more cost effective. Simply put, your marketing efforts should be the result of knowing where your new business comes from, and how much revenue you make from the new business, so you can focus on how to drive in more and keep more.
Key Metrics for Growth
To gain back some of that market share, independent agents will need to get more effective with their marketing. Let's take a look at what the high growth agencies specifically track to help achieve their high growth numbers. These tracking methods can help you grow too.
Many of these growth agencies tracked 14 common items. They fall into four categories: new business, average revenue per client, retention, and digital marketing effectiveness. Here's a look into each of them, along with a few key target examples so you can see how you compare. As you read through this, put a mental check mark by all that you're currently tracking in your agency.
New Business
Item 1: Total new business items
This is fairly easily tracked through agency management systems. Most can say how many new policies were written. But it gets tougher from here.
Item 2: Where each new policy comes from
Heres the big one. The most important question each person must ask on every call is, How did you hear about us? Everyone knows it. Without this, everything else falls apart. You can tell where the business comes from, which advertising dollars are most effective, where to focus your efforts and more, just from this question. Once asked, then the tracking begins. The more detailed you get, the more you'll learn. Here are 10 basic tracking categories:
Total new business items -
1. # from cross-selling efforts
2. # from client referrals
3. # from mortgage referrals
4. # from real estate referrals
5. # from walk-ins
6. # from captive agent referrals
7. # from print ads
8. # from website
9. # from Facebook / Instagram / LinkedIn
10. # from other
You can also track on a much deeper level. You can break out referral leads by each producer's clients. You can track referrals by individual mortgage companies, real estate agencies, title companies, and credit unions. This helps you understand which centers of influence are high quantity referral sources and thus where to spend time enhancing relationships. Or you can view the low production sources, so you can either change focus or drop the lead source completely.
Item 3: Close ratio by category
Learning your close ratio by category can also be a big boost. It's clear where you should spend your time if you know, for example, that your close ratios for mortgage companies and certain captive agent referrals are near 80% and other methods are at 25%.
Some of these agents who track close ratios know that their client referrals are closing around 70%, while other agencies know they close client referrals at 35%. Digging further, those with the higher close ratios are only considering true client referrals to be those where the person referred is calling for a quote. Agencies with the lower close ratio are accepting any name and phone number given by a client as a referral, but this means that the prospect may or may not be ready to look into insurance at the time you call, and the agency is spending resources to continue to call and follow up on each lead. Both methods can work, and several agents say that they want to encourage the behavior of giving any referral. But if you are tracking everything, at least you'll know which ones are most effective.
Item 4: Monthly close ratio by producer
This is an excellent training tool. If you know your agency closes referrals at 55%, but that your three producers are closing referrals at close ratios of 70%, 50%, and 35%, then you'll know where you should focus your sales training internally. Sounds easy, but you can't do this if you don't track close ratios!
Average Revenue per Client
Item 5: Total premium
Another easy one to track. This needs to be done for all personal lines in the agency, not just by the carrier, so compile the totals and read on.
Item 6: Total policies
Also easy to track by totaling all of your policies by carrier into one agency number.
Item 7: Total number of clients
This equates to total households. Pull the total number of addresses from your agency management system to get this tally.
Item 8: Average number of policies per client
Divide total policies into the total number of clients to get this number. This is one of the most helpful statistics you have to tell you how your team is cross-selling your book. A rough average of the number of policies per client to use is 1.6. If you're averaging 1.4, you know that one of the first things you should do is a big cross-sell effort throughout your book. Cross-selling boosts both new business and retention, so if your average policies per client are 1.6 or less, you should focus your marketing efforts here first.
What is the high-end ceiling for average policies per client? Very few agencies average 3 or more policies per personal lines client. It is challenging to move your book one-tenth of a point in this category. But if you track it monthly and can see growth over 3 months of 1.72, 1.73, 1.74, you know you're making solid progress on cross-selling. If not, you may want to do some cross-selling mailings with phone call follow-ups. Or it may show a need for you to do more internal sales training on cross-selling to protect your clients properly.
Item 9: Average premium per policy
To find this amount, divide the total premium by the total number of policies.
Item 10: Average revenue per client
This is more challenging, but its the jewel of tracking numbers for every agency. To determine the average revenue per client, multiply the average premium per policy by average policies per client. For example, if your average premium per policy is $1000, and your average policies per client are 1.6, then your average premium per client is $1600.
Now multiply your average premium per client by your average commission. For example, $1600 average premium per client times your average commission of 13% would equate to average revenue per client like this: $1600 x .13 = $208 average agency revenue per client.
What is a good target range for average revenue per client in personal lines? Heavy non-standard agencies selling mostly monoline auto will be in the $140 to $180 range. In low catastrophe areas, average preferred agencies will see $200 to $275. In more affluent areas or places with increased catastrophe exposure, the average revenue per client is higher, averaging $300 to $350 per client.
Once you know this number, and you know where your business comes from, you can easily track your return on your investment. Agents who know these numbers are shooting for a 1 to 1 first year return on all of their marketing. For example, if you're spending $1,000 per month on Google ads, and your average revenue per client is $200, then you would need to write 5 new clients each month to get a 1 to 1 return. If you're not, then you may want to consider reducing your marketing in that area. If your newsletters are driving a 1 to 1 first year return or better based on the increased referral traffic, then you know your marketing is paying off.
Retention
Item 11: Retention for your entire book each month
To determine your monthly average retention, you'll need to know:
-- Total policies from 12 months ago
-- Total policies as of the last month end
-- New business total policies written over the past 12 months
For example, let's say 12 months ago you had 1000 policies. At the end of the 12 months ending last month, you had 1150 policies. Subtract the 250 policies you wrote new over the 12 months from the ending total of 1150, and you kept 900 or 90% of the original 1000. (Be sure you're not counting rewrites as new!)
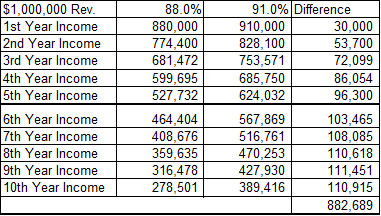
Is focusing on retention worth it? Heres how to find out. Multiply your current annual revenue by your current retention rate. Do that over 10 years. Don't add in new business; just see what happens to your current book over 10 years. Then multiply the same starting annual revenue by a retention number 3 points higher over 10 years, and calculate the difference. Heres what it looks like for a $1 million revenue agency that moves its retention from 88% to 91%:
Item 12: Average length of time clients stay with you
Determine the number of years each client has been with you. Tracking in whole years as opposed to months is easier when you start. Add up all the year's clients have been with you (this will be big). Then divide that total and divide by the number of clients you have. This will give you the average length of time clients stay with you. Excellent marketing tactics should deliver a $1.00 return for every $1.00 spent or better in the first year, but you get a much stronger picture for how profitable your marketing is when you know how long you retain your clients on average.
Item 13: Website analytics. Your website is your virtual office. Potential clients are researching you before they decide to buy. Current clients are using your website as a source of information. How do you keep track of your website's effectiveness? Your first step is to install analytics on your website. Talk to your website developer about Google analytics. Once analytics are installed, you can log in and see things such as:
- How many people visited your website
- Which pages are visited most often
- How people find your website (are the entering through Google or Facebook)
- If people are clicking your calls to action
Item 14: Email marketing campaign open rates Understanding open rates are an important aspect of your marketing strategy; it allows you to take action based on hard data. The key is to know what metrics you need to review and how to interpret them. The top metrics to understand with each email marketing campaign are:
- Open rates
- Click-through rates
The industry average open rate for non-sales related email marketing campaigns is between 15-20%. (Constant Contact data) When you first start communicating you may see high open rates as your clients are curious to read your new communications; the key is to sustain the higher rates. As you review your open rates pay close attention to any dips or trends downward that could indicate that you need to act and respond with communications that have higher engagement. The more personalized your stories are, the higher your open rates will climb. Agencies that focus on community activities, stories about their staff outside of work, and about the charities they partner with quarterly for their referral programs average as high as 40% with their open rates, with the highest we've seen at 52% per month. Agencies that focus on insurance news and safety tips drop open rates down to the low teens and single digits.Click-through rates indicate interest in a particular topic or create a potential follow-up for the agency. Monitoring the click-through rate of your calls to action could lead to additional sales for the agency. Click-through links that take people to your website increase your website traffic and in turn raise your search engine results. Links to your referral page, staff biographies, in-depth stories about the charities you work with and regularly updated community calendars do well as links to your website. Keep tracking each of these metrics on a monthly basis. Over time you'll enjoy seeing how your marketing efforts contribute to growth, rising retention levels, and stronger profitability.
Chuck Blondino is the Northwest Region Marketing Director for Safeco Insurance, Member of Liberty Mutual Group. Chuck wrote this article for ACT and he can be reached at Chuck.Blondino@Safeco.com. This article reflects the views of the author and is not an official statement by Safeco Insurance or by ACT.